

In this article
- Key takeaways
- Official figures at a glance
- How this page was compiled
- What are the National Health Expenditure Accounts?
- How much did the United States spend on health care in 2024?
- Who paid the bills, and who financed them?
- Where did the money go?
- How do official projections for 2025-2034 differ from the 2024 history?
- What do these figures not tell you?
- FAQ
- How much did the United States spend on health care in 2024?
- What share of the U.S. economy was that?
- Who was the largest payer in 2024?
- Is the $5.7 trillion figure for 2025 an official actual, or a projection?
- Do out-of-pocket payments include health insurance premiums?
- Sources
- Changelog
This article explains official U.S. health spending estimates from the Centers for Medicare & Medicaid Services. It is not medical advice.
Official CMS estimates show U.S. health spending rose 7.2% in 2024 to $5.3 trillion, or $15,474 per person, and 18.0% of GDP. Private health insurance was the largest source of funds, at $1,644.6 billion. Hospital care was the largest service category, at $1,634.7 billion. CMS projects spending of $5.7 trillion in 2025.
Key takeaways
- The National Health Expenditure Accounts are CMS’s official estimates of total U.S. health spending. The latest historical year is 2024. Spending grew 7.2% to $5.3 trillion, or $15,474 per person, and accounted for 18.0% of GDP, up from 17.7% in 2023 (CMS historical NHE page; NHE Fact Sheet; 2024 Highlights).
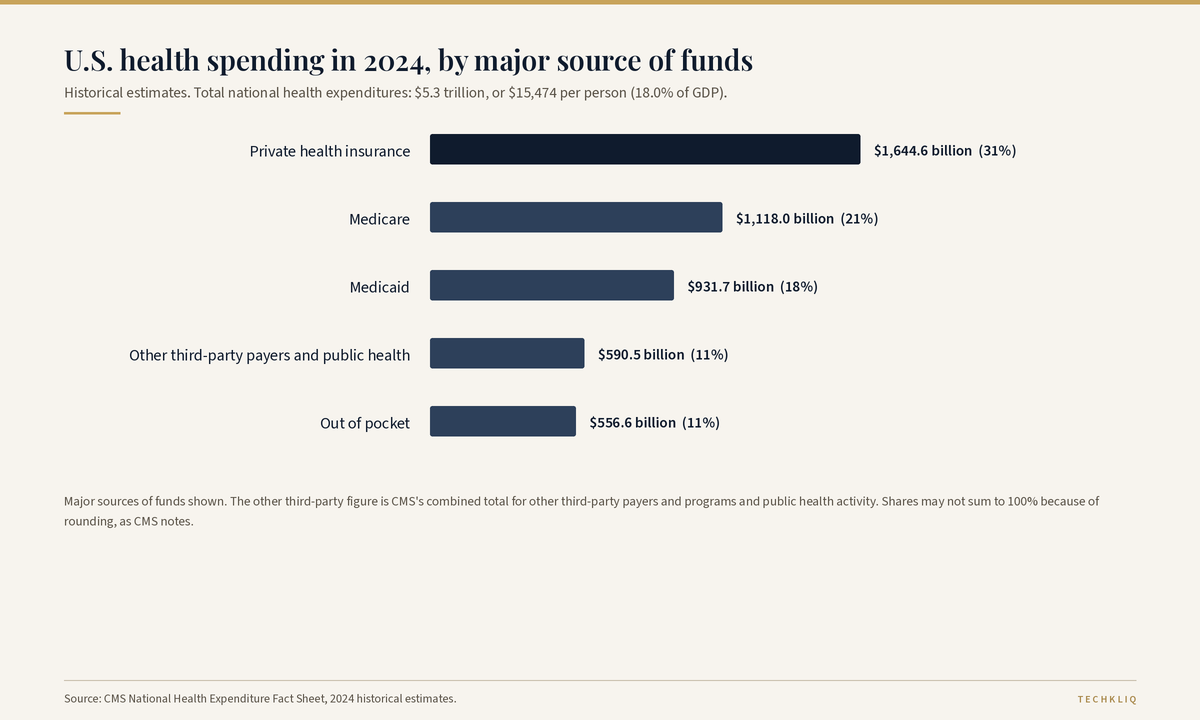
- By source of funds, private health insurance was $1,644.6 billion (31% of NHE), Medicare $1,118.0 billion (21%), Medicaid $931.7 billion (18%) and out-of-pocket spending $556.6 billion (11%) (NHE Fact Sheet).
- By type of service, hospital care was $1,634.7 billion (8.9% growth), physician and clinical services $1,109.7 billion (8.1%) and retail prescription drugs $467.0 billion (7.9%) (NHE Fact Sheet).
- By sponsor, meaning the entity that finances the bill, the federal government accounted for 31% of spending and households for 28%. Private businesses accounted for 18%, state and local governments for 16%, and other private revenues for 6% (NHE Fact Sheet; 2024 Highlights).
- These 2024 figures are historical estimates. CMS’s Office of the Actuary also publishes projections, which are forecasts. The latest set projects national health spending of $5.7 trillion in 2025 and $9.0 trillion in 2034, or 20.6% of GDP (NHE Projections 2025-2034 Forecast Summary).
Official figures at a glance
Unless noted, the figures below are historical estimates for calendar year 2024. Projected figures are labeled as such. Shares may not sum to 100% because of rounding, as CMS notes on its “nation’s health dollar” charts.
| Figure | What it measures | Source | Period | Notes |
|---|---|---|---|---|
| $5.3 trillion; $15,474 per person; 7.2% growth | Total national health expenditures | CMS historical NHE page; NHE Fact Sheet | 2024 | Official estimates, not a forecast |
| 18.0% of GDP | Health spending as a share of the economy | CMS historical NHE page; 2024 Highlights | 2024 | Up from 17.7% in 2023 and 17.6% in 2022 |
| 2.5% medical prices; 4.7% non-price factors | CMS breakdown of the 7.2% spending increase | NHE 2024 Highlights infographic | 2024 | Non-price factors include the use and mix of goods and services, and changes in the size and demographic mix of the population |
| $1,644.6 billion private health insurance; $1,118.0 billion Medicare; $931.7 billion Medicaid; $556.6 billion out of pocket | Major sources of funds | NHE Fact Sheet | 2024 | Shares: 31%, 21%, 18% and 11% of total NHE |
| $1,634.7 billion hospital care; $1,109.7 billion physician and clinical services; $467.0 billion retail prescription drugs | Major spending categories | NHE Fact Sheet | 2024 | Growth of 8.9%, 8.1% and 7.9%, respectively |
| 91.8% insured share of the population | People with health coverage, all insurance types combined | 2024 Highlights; NHE Fact Sheet | 2024 | Down from a peak of 92.5% in 2023 |
| $5.7 trillion; 7.3% growth (projected) | Projected national health spending | NHE Projections 2025-2034 Forecast Summary | 2025 | A forecast, issued after the 2024 historical year |
| $9.0 trillion; 20.6% of GDP (projected) | Projected national health spending and GDP share | NHE Projections 2025-2034 Forecast Summary | 2034 | Average projected NHE growth of 5.4% a year over 2025-34, compared with 4.1% for GDP |
How this page was compiled
This page uses the Centers for Medicare & Medicaid Services’ National Health Expenditure Accounts, compiled by the Office of the Actuary’s National Health Statistics Group. Historical 2024 figures come from the CMS historical NHE page, the NHE Fact Sheet, National Health Expenditures 2024 Highlights, the 2024 highlights infographic, and The Nation's Health Dollar, calendar year 2024. Definitions come from CMS’s quick definitions and the NHEA Methodology Paper, 2024, last updated January 2026. Projected figures come from the NHE Projections 2025-2034 Forecast Summary and are labeled as projections. Peterson-KFF charts, news summaries and unofficial round-ups were excluded. Figures are current as of 17 November 2026. If CMS revises the accounts or publishes a later historical year, this page should be updated. Corrections are covered by Techkliq’s editorial policy.
What are the National Health Expenditure Accounts?
CMS describes the National Health Expenditure Accounts as “the official estimates of total health care spending in the United States.” The series dates back to 1960 and measures annual spending on health care goods and services, public health activities, government administration, non-medical insurance expenditures, and investment related to health care. The estimates are presented by type of service, source of funds, and type of sponsor (CMS historical NHE page).
The Office of the Actuary’s methodology paper, last updated in January 2026, says HHS and its predecessor agencies have published the annual series since 1964, “with the goal of measuring the total annual dollar amount of health care consumption in the U.S., as well as the dollar amount invested in medical sector structures and equipment and non-commercial research.” The accounts are designed to be comprehensive, to use a common set of definitions over time, and to be generally compatible with the Bureau of Economic Analysis’ National Income and Product Accounts, while covering the health sector in more detail (NHEA Methodology Paper, 2024).
CMS also revises the entire series when it completes a comprehensive benchmark, most recently in the 2024 vintage of the accounts. That means a figure for an earlier year in the current release may differ from a number published before the benchmark (NHEA Methodology Paper, 2024).
Two distinctions in the accounts matter for reading the tables. A source of funds is the payer or program that paid the bill, such as private health insurance, Medicare, Medicaid or out-of-pocket payments. Out-of-pocket payments include copayments, deductibles and amounts not covered by insurance, but not premiums paid by individuals; those premiums are counted under private health insurance (CMS quick definitions; The Nation's Health Dollar). A sponsor is “the entity that is ultimately responsible for financing the health care bill,” such as the federal government, households, private businesses, or state and local governments (2024 Highlights, footnote 1).
How much did the United States spend on health care in 2024?
CMS’s official estimate is $5.3 trillion, or $15,474 per person. Spending grew 7.2% in 2024, after 7.4% growth in 2023. Because that growth outpaced the rest of the economy, health spending’s share of GDP rose from 17.7% in 2023 to 18.0% in 2024 (CMS historical NHE page; 2024 Highlights). CMS’s highlights infographic also shows the GDP share at 17.6% in 2022, and spending growth of 4.1% in 2021 and 4.8% in 2022, before the faster increases in 2023 and 2024 (NHE 2024 Highlights infographic).
The 2024 Highlights say the 2023-24 trend “was largely driven by heightened demand for health care services.” Personal health care spending rose by an average of 8.9% a year over those two years, “the fastest pace of growth since 1991-1992, when the average was 9.1 percent” (2024 Highlights). The official infographic splits the 7.2% increase in 2024 into 2.5% medical prices and 4.7% non-price factors, “includ[ing] the use and mix of goods and services, changes in the population, and changes in the demographic mix of the population” (NHE 2024 Highlights infographic).
The insured share of the population was 91.8% in 2024, down from a peak of 92.5% in 2023. Private health insurance enrollment rose from 207.0 million in 2023 to 214.3 million in 2024, including 21.1 million Marketplace enrollees, up from 16.2 million in 2023. Medicaid enrollment fell from 92.2 million to 84.3 million, a decline of 8.6%, or 7.9 million people, as states resumed eligibility redeterminations after pandemic-era coverage rules ended. Medicare enrollment grew 2.2% to 66.6 million (2024 Highlights; NHE 2024 Highlights infographic).
Who paid the bills, and who financed them?
By source of funds, private health insurance was the largest payer in 2024, at $1,644.6 billion, or 31% of total NHE, after 8.8% growth. Medicare spending grew 7.8% to $1,118.0 billion, or 21%. Medicaid spending grew 6.6% to $931.7 billion, or 18%. Out-of-pocket spending grew 5.9% to $556.6 billion, or 11%. Spending by other third-party payers and programs and public health activity fell 7.0% to $590.5 billion, also 11% of the total (NHE Fact Sheet). CMS’s “nation’s health dollar” chart groups the insurance programs together as 74% of the $5.3 trillion, with out-of-pocket payments at 11%, other third-party payers and programs at 8%, investment at 5%, and government public health activities at 3% (The Nation's Health Dollar).
The same dollars look different when CMS assigns them to sponsors. The federal government financed 31% of spending, or $1.7 trillion, after 5.5% growth. Households financed 28%, or $1.5 trillion, after 6.9% growth. Private businesses financed 18%, or $967.4 billion, after 5.6% growth. State and local governments financed 16%, or $859.7 billion, after 12.1% growth, including a 19.2% increase in the state portion of Medicaid payments as a temporary pandemic-era increase in the federal Medicaid match was phased out. Other private revenues accounted for 6% (NHE Fact Sheet; 2024 Highlights).
Medicaid illustrates why enrollment and spending can move in opposite directions. Enrollment fell 8.6% in 2024, but spending still rose 6.6%, and spending per enrollee rose 16.6%. CMS attributes that per-enrollee increase to a change in the mix of remaining enrollees, rising provider rates, and continued growth in state-directed payments to providers through managed care (2024 Highlights).
Where did the money go?
Hospital care was the largest service category, at $1,634.7 billion, or 31% of spending, after 8.9% growth. That was slower than the 10.6% increase in 2023, but still a second year of strong growth. Physician and clinical services grew 8.1% to $1,109.7 billion, or 21% of spending. Retail prescription drug spending grew 7.9% to $467.0 billion, or 9% of spending, slower than the 10.8% increase in 2023 (NHE Fact Sheet; 2024 Highlights).
CMS’s “where it went” chart for 2024 also assigns 7% to government administration and non-medical insurance expenditures, 6% to other health, residential and personal care services, 5% to investment, 4% each to nursing care facilities and continuing care retirement communities, dental services, and other professional services, 3% each to public health activities and home health care, and 2% each to other non-durable medical products and durable medical equipment (The Nation's Health Dollar). Those category shares are official rounded totals; the Highlights give more precise dollar amounts for several of the smaller categories, including $320.5 billion for other health, residential and personal care services, $219.9 billion for nursing care facilities and continuing care retirement communities, $189.2 billion for dental services, $184.9 billion for other professional services, $169.4 billion for home health care, $128.7 billion for other non-durable medical products, and $86.4 billion for durable medical equipment (2024 Highlights).
Retail prescription drugs in the accounts cover “the ‘retail’ sales of human-use dosage-form drugs, biological drugs, and diagnostic products that are available only by a prescription.” They do not include drugs billed through hospitals or other settings (CMS quick definitions).
How do official projections for 2025-2034 differ from the 2024 history?
The 2024 numbers above are historical estimates. CMS also publishes a separate projections series. “The latest projections begin after the latest historical year (2024) and go through 2034” (CMS projected NHE page).
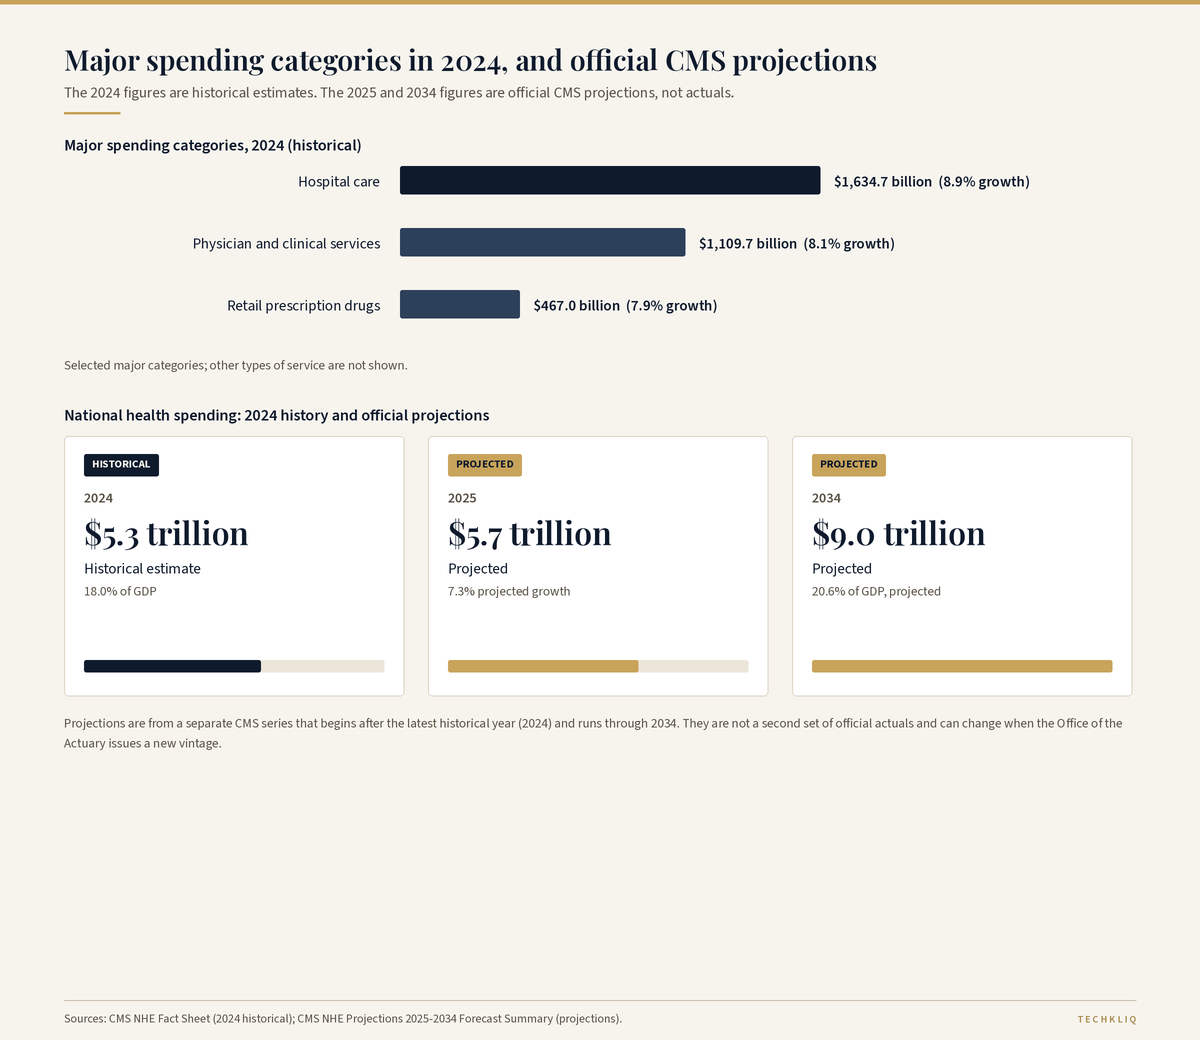
In the Forecast Summary for 2025-34, CMS projects that national health spending “remained strong at 7.3 percent in 2025 and [reached] $5.7 trillion.” Over 2025-34, average NHE growth is projected at 5.4% a year, faster than the 4.1% projected for GDP, taking the health share of GDP from 18.0% in 2024 to 20.6% in 2034, or $9.0 trillion. Medicare is projected to be the fastest-growing major source of funds, at 7.7% a year on average. Medicaid and private health insurance are each projected to grow 5.0% a year on average. Among major service categories, retail prescription drugs are projected to grow fastest, at 5.7% a year, followed by physician and clinical services at 5.5% and hospital care at 5.2%. The insured share of the population is projected to be 90.5% in 2034, compared with 91.8% in 2024. The federal government’s sponsored share is projected to rise from 31% to 33% (NHE Projections 2025-2034 Forecast Summary).
Those later-year figures depend on assumptions CMS spells out, including slower projected growth in 2026 after the expiration of enhanced Marketplace subsidies, and further slowing in 2027-28 that CMS links in part to Medicaid enrollment changes under legislation it refers to as the One Big Beautiful Bill Act. They are not a second set of official actuals, and they can change when the Office of the Actuary issues a new projections vintage.
What do these figures not tell you?
They are official estimates of spending, not a measure of whether care was effective, affordable for a given household, or equally distributed. A 7.2% increase in national spending can reflect prices, the amount and mix of services used, or a larger or older population; CMS’s own 2024 split attributes more of that year’s increase to non-price factors than to medical prices (NHE 2024 Highlights infographic).
They are also national totals. Out-of-pocket spending of $556.6 billion is 11% of NHE, but that is not a typical household’s share of its own medical bills, and it excludes premiums (NHE Fact Sheet; CMS quick definitions). Retail prescription drug spending of $467.0 billion excludes drugs billed by hospitals and some other providers. And because CMS revises the historical series when it benchmarks the accounts, a 2024 figure in a later vintage may not match the number on this page.
FAQ
How much did the United States spend on health care in 2024?
CMS estimates that national health expenditures reached $5.3 trillion in 2024, or $15,474 per person, after 7.2% growth (CMS historical NHE page; NHE Fact Sheet).
What share of the U.S. economy was that?
Health spending accounted for 18.0% of GDP in 2024, up from 17.7% in 2023 (CMS historical NHE page; 2024 Highlights).
Who was the largest payer in 2024?
By source of funds, private health insurance was the largest, at $1,644.6 billion, or 31% of total NHE. Medicare was second, at $1,118.0 billion, or 21%. By sponsor, the federal government and households were the largest, at 31% and 28% (NHE Fact Sheet).
Is the .7 trillion figure for 2025 an official actual, or a projection?
It is a projection. The latest historical year in the National Health Expenditure Accounts is 2024. CMS’s Office of the Actuary projects that spending grew 7.3% in 2025 and reached $5.7 trillion (NHE Projections 2025-2034 Forecast Summary; CMS projected NHE page).
Do out-of-pocket payments include health insurance premiums?
No. In the NHEA, out-of-pocket payments are direct spending by consumers, including coinsurance, deductibles and amounts not covered by insurance. “Premiums paid by individuals for private health insurance are not covered here, but are counted as part of Private Health Insurance” (CMS quick definitions).
Sources
1. Centers for Medicare & Medicaid Services, “Historical,” National Health Expenditure Data. Retrieved 17 November 2026 (Asia/Calcutta). https://www.cms.gov/data-research/statistics-trends-and-reports/national-health-expenditure-data/historical
2. CMS, “NHE Fact Sheet.” Retrieved 17 November 2026 (Asia/Calcutta). https://www.cms.gov/data-research/statistics-trends-and-reports/national-health-expenditure-data/nhe-fact-sheet
3. CMS, Office of the Actuary, National Health Expenditures 2024 Highlights. Retrieved 17 November 2026 (Asia/Calcutta). https://www.cms.gov/files/document/highlights.pdf
4. CMS, National Health Expenditures 2024 Highlights infographic. Retrieved 17 November 2026 (Asia/Calcutta). https://www.cms.gov/files/document/nhe-infographic.pdf
5. CMS, Office of the Actuary, National Health Statistics Group, The Nation’s Health Dollar ($5.3 Trillion), Calendar Year 2024. Retrieved 17 November 2026 (Asia/Calcutta). https://www.cms.gov/files/document/nations-health-dollar-where-it-came-where-it-went.pdf
6. CMS, Quick Definitions for National Health Expenditure Accounts (NHEA) Categories. Retrieved 17 November 2026 (Asia/Calcutta). https://www.cms.gov/files/document/quick-definitions-national-health-expenditures-accounts-nhea-categories.pdf
7. CMS, Office of the Actuary, National Health Statistics Group, National Health Expenditure Accounts (NHEA): Methodology Paper, 2024, last updated January 2026. Retrieved 17 November 2026 (Asia/Calcutta). https://www.cms.gov/files/document/definitions-sources-methods.pdf
8. CMS, “Projected,” National Health Expenditure Data. Retrieved 17 November 2026 (Asia/Calcutta). https://www.cms.gov/data-research/statistics-trends-and-reports/national-health-expenditure-data/projected
9. CMS, Office of the Actuary, National Health Expenditure Projections 2025-2034 Forecast Summary. Retrieved 17 November 2026 (Asia/Calcutta). https://www.cms.gov/files/document/nhe-projections-forecast-summary.pdf
Changelog
- 17 November 2026: Initial version, based on CMS National Health Expenditure Accounts historical estimates for 2024 and official projections for 2025-2034, opened on this date.